The
Response spectrum analysis uses and combines the spectrum
data, corresponding to the absolute maximum values of
the time response for each mode, using the principle of
superposition. Because the simultaneity of the maximum
value occurrence for each mode is not considered and only
the absolute maximum values are combined, it is considered
as an approximate solution to the Modal linear time history
analysis. However, the correlation between modes is considered
in the mode combination to correct for simultaneity errors.
Spectrum data
A
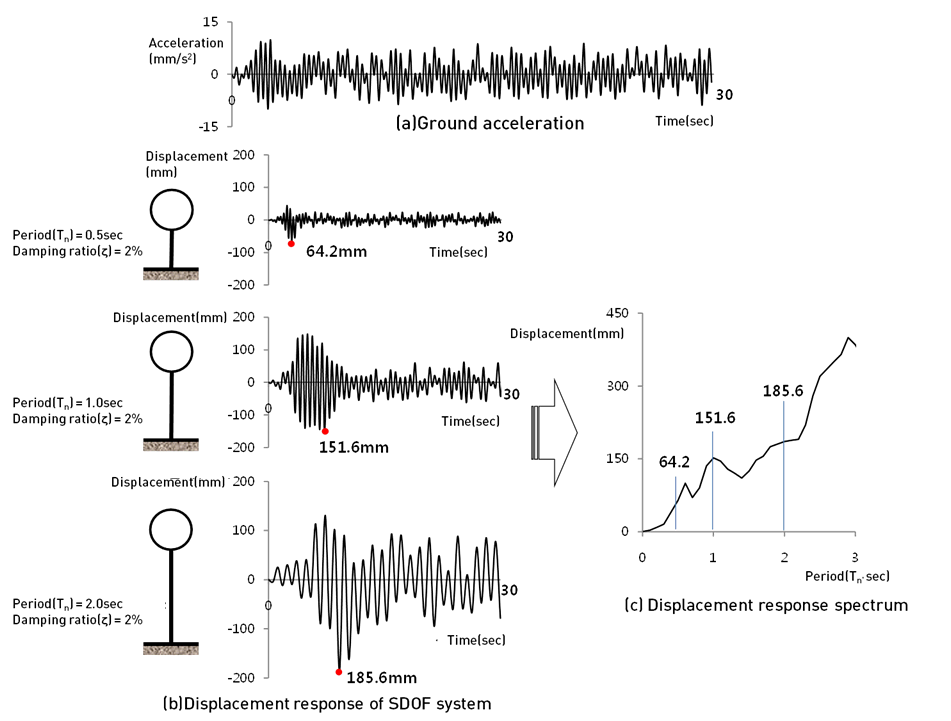
spectrum data is the absolute maximum displacement (or
velocity, acceleration) values found by fixing the damping
ratio and changing the period (mass, stiffness) of a single
DOF system for a time history data. Because the damping
ratio for each mode of the structure can be different,
instead of using a spectrum data for one damping ratio,
multiple spectrum data for different damping ratios are
created and interpolated for the damping ratio. The period
spacing used to create the spectrum data can be different
to the natural period of the structure and so, interpolation
for the natural period is also needed. Both linear interpolation
and logarithmic interpolation are supported. Also, the
spectrum data generally uses the design response spectrum
created from the statistical historic earthquake data
in the target region, rather than converting a particular
given data. Because a design response spectrum with one
damping ratio is generally used, correction instead of
interpolation is applied for this case.

<Create displacement response
spectrum of SDOF system>
Damping consideration
Damping
consideration is essential for accurate dynamic analysis.
All real structures cannot vibrate infinitely and
the energy loss at the molecular level, or energy loss
in the structure due to interaction between component
elements, applies damping to the system and gradually
decreases the vibrations of the structure.
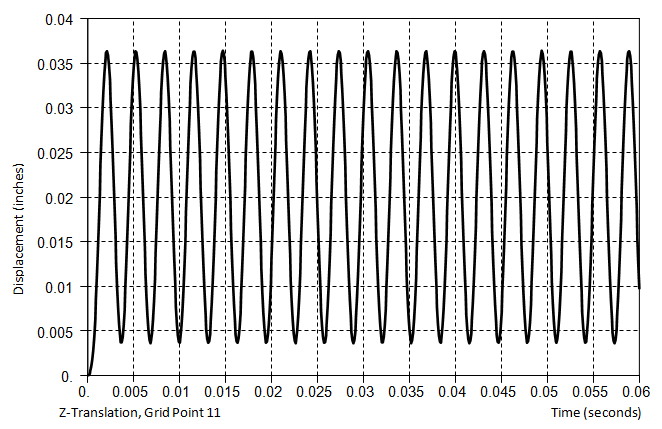
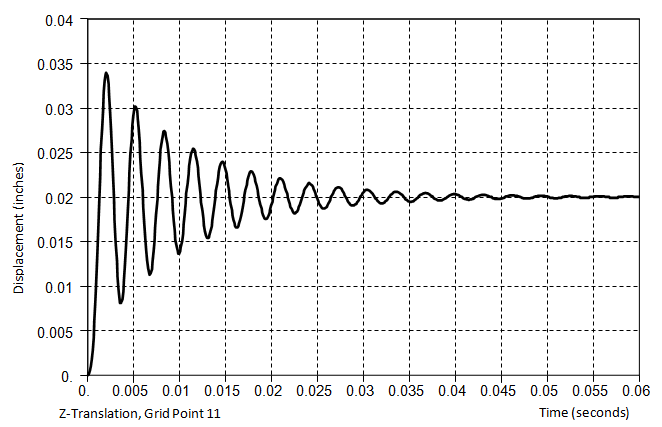
In
particular, for stimulation near the natural frequency
region (resonance effect) of the structure, damping has
a dominant effect on the analysis results.


<Without
damping> <With
damping effects>
The
accurate damping ratio of the structure needs to be determined
through experimentation, and the generally used damping
ratios used are as follows.
System |
Damping ratio |
Steel (within elastic region) |
<
1 % |
Steel structure with
joint |
3
% ~ 7 % |
Pipe system with small
diameter |
1
% ~ 2 % |
Pipe system with large
diameter |
2
% ~ 3 % |
Rubber material |
~
5 % |
Prestressed concrete structure |
2
% ~ 3 % |
RC structure |
4
% ~ 7 % |
The
modal damping is most frequently used to express the structural
damping for general numerical analysis. The modal damping
determines the damping for each natural frequency in the
system and can be largely divided into proportional and
non-proportional damping. Proportional damping can use
the mass proportional type, stiffness proportional type
or Rayleigh type damping.
Mass
proportional damping expresses the viscous damping due
to external factors such as air resistance and assumes
that the damping matrix is proportional to the mass. For
stiffness proportional damping, the dissipation damping
effect (vibration energy dissipated to the ground) is
hard to express directly and is assumed to be proportional
to the damping stiffness. Hence, the damping can be overestimated
at higher modes.
Rayleigh
damping is the stiffness proportional type corrected for
the damping constant at higher modes and can be expressed
as the sum of the mass proportional type and stiffness
proportional type. |


